2 Where Error Comes From
Where this chapter fits. Every step of the research process can add error to the final number. This chapter names the kinds of error, so that the later chapters can address them one at a time.
2.1 Four Groups, One Question
How many immigrants live in the United States without legal authorization? No agency keeps a list. The number has to be estimated, and four research groups publish estimates that reporters and lawmakers cite.
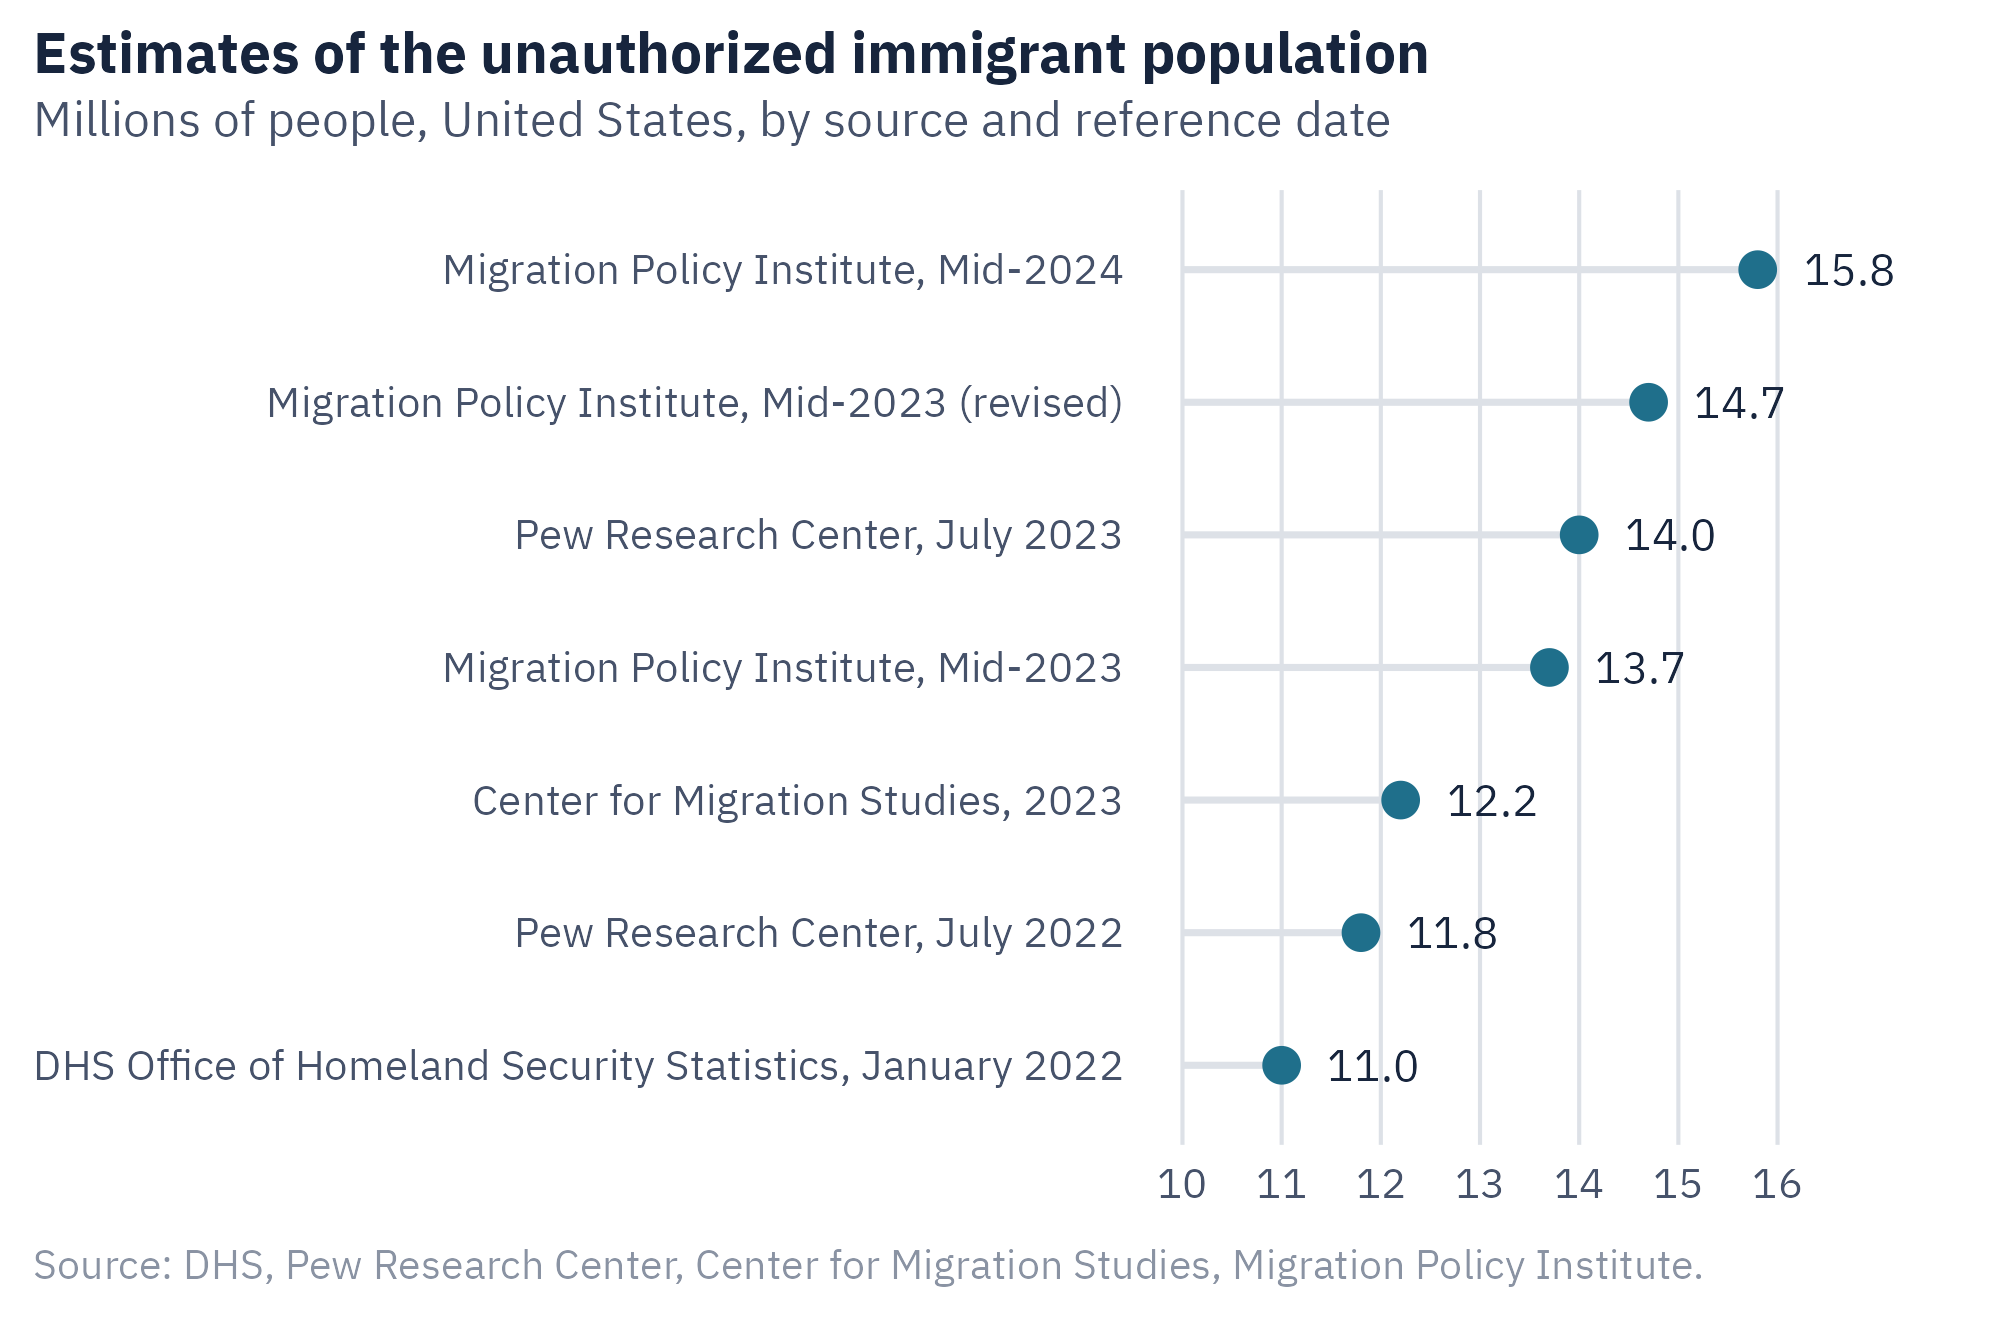
In August 2025, the Pew Research Center reported 14.0 million for July 2023. The Migration Policy Institute first reported 13.7 million for the middle of 2023 and later revised that figure to 14.7 million. The Center for Migration Studies reported 12.2 million for 2023. The most recent estimate from the Department of Homeland Security was 11.0 million, for January 2022. Figure 2.1 shows these estimates and three others from the same groups.
The estimates for 2023 differ by 2.5 million people. All four groups use the same basic method, and all four start from the same Census Bureau survey. The differences come from choices made at each step of the work.
This chapter uses the four estimates to introduce a framework. The framework lists every step at which a survey number can depart from the truth. Each later chapter in this book covers one or two of those steps.
2.2 How the Estimate Is Built
The four groups use a residual method. It has three steps.
- Estimate the total number of foreign-born people living in the country. This figure comes from the American Community Survey, which the Census Bureau sends to about 3.5 million addresses a year.
- Estimate the number of foreign-born people who are in the country legally. This figure comes from government records of naturalized citizens, permanent residents, refugees, and visa holders.
- Subtract the second number from the first. The remainder, or residual, is the estimate of the unauthorized population.
The method is reasonable, and it is the best one available. It also depends on a survey, and surveys contain error. A small error in the first step becomes a large error in the residual. The total foreign-born population is about 50 million. Suppose the survey misses 2 percent of them. The first number is then low by 1 million, and the residual is low by the same 1 million.
2.3 Error Is Not the Same as a Mistake
In everyday speech, an error is a mistake. In survey research, error means the difference between an estimate and the true value. A study can be done with care and still contain error. Error cannot be removed. It can be reduced, measured, and reported.
Error has two forms, and they behave differently.
Variable error differs from one run of the study to the next. If the same survey were repeated with a new sample, the result would change a little each time. The changes go in both directions and tend to cancel out when many results are averaged. A larger sample reduces this kind of error.
Bias pushes the result in one direction every time. If a survey cannot reach people without a fixed address, it will undercount them in every run. Repeating the survey does not help. A larger sample does not help either. It gives a more precise estimate of the wrong number.
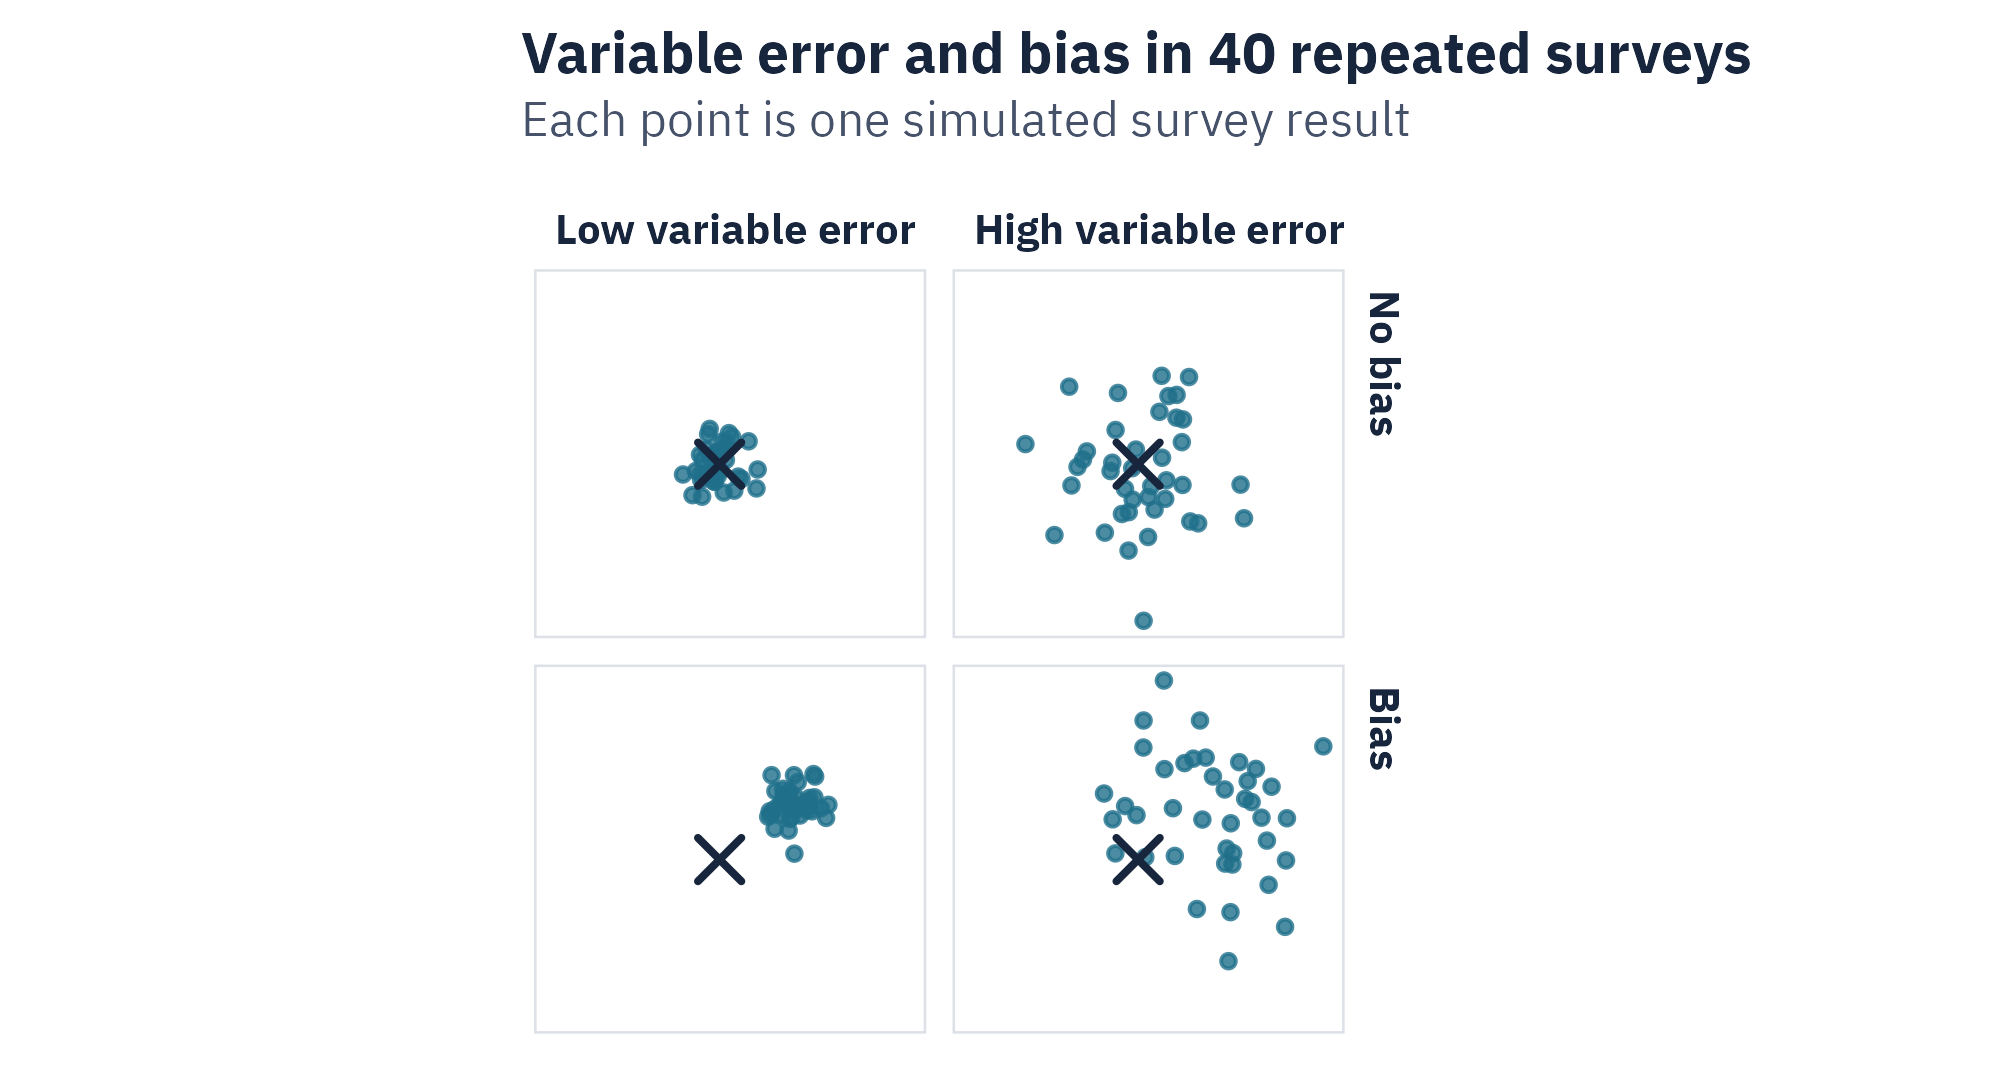
Figure 2.2 shows the four combinations. The lower left panel is the most misleading case. The results agree closely with one another, and all of them are wrong. Agreement among results is not evidence that the results are accurate.
2.4 The Total Survey Error Framework
Survey researchers organize the sources of error into a framework called total survey error. Groves and colleagues (2009) present it as two paths. One path concerns whom the survey describes. The other concerns what the survey measures.
Whom the Survey Describes
A survey aims to describe a target population. For the American Community Survey, the target is every person living in the United States. Four kinds of error can enter between the target population and the final dataset.
- Coverage error. The sampling frame is the list from which the sample is drawn. The American Community Survey draws from a list of addresses. People who are not linked to a listed address have no chance of selection. Coverage error is the difference between the target population and the frame. Recent arrivals who share housing or move often are more likely to be missed.
- Sampling error. A survey measures a sample and not the whole frame. A different sample would give a slightly different result. This is variable error, and it can be calculated.
- Nonresponse error. Some people who are selected do not answer. If the people who do not answer differ from those who do, the result is biased. Immigrants without legal status may have reasons to avoid a government survey.
- Adjustment error. Researchers apply weights to make the sample match known population totals. The weights depend on those totals. If the totals are wrong, the weights carry the error into every result.
What the Survey Measures
Three more kinds of error can enter between the concept and the recorded answer.
- Validity. The question may not capture the concept the researcher has in mind. The American Community Survey asks where a person was born and whether the person is a citizen. It does not ask about legal status. Legal status has to be inferred, and the four groups infer it in different ways.
- Measurement error. The answer a respondent gives may differ from the truth. A respondent may misunderstand the question, may not know the answer, or may prefer not to give it.
- Processing error. Errors can enter when answers are coded, edited, or filled in. When a respondent skips a question, the Census Bureau estimates the missing value from similar respondents. That estimate can be wrong.
Table 2.1 summarizes the seven sources.
| Source of error | The question it raises | Where this book covers it |
|---|---|---|
| Coverage | Who had no chance of being selected? | Chapter 6 |
| Sampling | How much would the result change with a new sample? | Chapter 6 |
| Nonresponse | Who was selected and did not answer? | Chapters 6 and 7 |
| Adjustment | What totals were the weights based on? | Chapter 6 |
| Validity | Does the question capture the concept? | Chapters 1 and 4 |
| Measurement | Did respondents answer accurately? | Chapters 4 and 5 |
| Processing | What happened to the answers after they were given? | Chapter 7 |
2.5 Tracing the Four Estimates
The framework explains most of the gap among the estimates in Figure 2.1.
Reference date. The estimates refer to different dates. The Department of Homeland Security figure is for January 2022. The Pew figure is for July 2023. The population grew quickly between those dates, and so the two figures should differ. This is a difference in the research question and not an error. A reader who compares them without checking the dates will see a disagreement that is partly a difference in timing.
Adjustment. In December 2024, the Census Bureau raised its estimates of immigration for 2021 through 2023. The survey weights for those years had been based on the earlier, lower totals. Pew reweighted the survey data to match the new totals. Its estimate for 2022 rose from 11.0 million to 11.8 million. No new data had been collected. The change came from the weights.
Coverage. The survey misses some immigrants, and each group adds people back to correct for the undercount. They use different correction rates. The Migration Policy Institute adopted a method that corrects more fully for people the survey missed. Its estimate for 2023 rose from 13.7 million to 14.7 million.
Validity. The category itself needs a definition. Pew reports that about 6 million of the 14 million people in its 2023 estimate had some protection from deportation. These include people with pending asylum claims and people with temporary protected status. All four groups count them as unauthorized. A reader who assumes that “unauthorized” means “subject to removal” will misread the total.
None of these differences is a mistake by the researchers. Each group documents its choices. A reader who cites one number without its date, its definition, and its correction for undercount has left out the information needed to interpret it.
2.6 Work With the Data: Survey Error Tree
The section above traced four estimates to their sources of error. The tool gives you ten more cases to sort. Each case describes a problem in a survey.
Open Survey Error Tree in its own window
- Read the case. Before you choose, ask the seven questions in the table under the cases.
- Choose the source of error that fits best. Read the explanation, including when your choice was correct.
- Work through all ten cases. The tool reports your score at the end.
- For each case you missed, name the question from the table that would have led you to the better answer.
Some cases fit more than one source. Case 9 is a question that asks two things at once. The wording is the cause, and the damage shows up as inaccurate answers. When two sources seem to fit, name the step in the survey where the error entered.
2.7 What a Margin of Error Covers
News reports often give a margin of error with a survey result. The margin of error describes sampling error. It describes how much the result would be expected to vary if the survey were repeated with new samples of the same size.
It leaves out the other six sources in Table 2.1. For the immigration estimates, sampling error is small, because the survey is very large. The differences among the four groups are many times larger than the sampling error of any one estimate.
This is a common pattern. In large surveys, bias from the other six sources is usually larger than sampling error. A report that gives only a margin of error has described the one source of error that is easiest to calculate.
A Rule for Comparing Two Numbers
Before you compare two estimates, check four things. They are the reference date, the definition, the source of the data, and any correction the authors applied. If any of the four differs, part of the gap between the numbers comes from that difference.
Ethics Moment: The Cost of Being Counted
The people in this case have reasons to avoid a government survey. A person who answers may fear that the answer will be used against the household. That fear lowers response and makes the estimate worse. It also places a duty on the researcher. Federal law bars the Census Bureau from sharing individual answers with any other agency. A researcher who collects sensitive data has to offer the same kind of protection, state it plainly, and keep the promise. Chapter 7 returns to this duty.
AI Reality Check: One Number, No Method
Ask a language model how many unauthorized immigrants live in the United States, and it will often give one number. It may not say which group produced the number or what date it refers to. Its answer may also predate the most recent revision. Ask for the source, the reference date, and the definition. Then ask what other groups report for the same date. A single figure with no method attached should be treated as a starting point for a search.
2.8 Putting It All Together
Error is the difference between an estimate and the true value. Variable error changes from one sample to the next and falls as the sample grows. Bias pushes every result in the same direction and does not fall as the sample grows.
The total survey error framework lists seven sources. Four concern whom the survey describes. They are coverage, sampling, nonresponse, and adjustment. Three concern what the survey measures. They are validity, measurement, and processing. The margin of error covers only sampling.
The four estimates of the unauthorized population differ by millions. The differences come from reference dates, weights, corrections for undercount, and definitions. Sampling error accounts for very little of the gap.
2.9 Looking Ahead
A survey describes a population. It can show that two things occur together, and it usually cannot show that one causes the other. Chapter 3 covers the design that can support a causal claim. The case is an experiment in which researchers mailed thousands of resumes to employers.
2.10 Further Reading and References
- Groves, R. M., Fowler, F. J., Couper, M. P., Lepkowski, J. M., Singer, E., and Tourangeau, R. (2009). Survey Methodology (2nd ed.). Wiley. Chapter 2 presents the total survey error framework used in this chapter.
- Passel, J. S., and Krogstad, J. M. (2025). U.S. Unauthorized Immigrant Population Reached a Record 14 Million in 2023. Pew Research Center. The report describes the residual method and the reweighting of the 2022 estimate.
- Migration Policy Institute (2026). Following Years of High Border Arrivals, the U.S. Unauthorized Immigrant Population Hits New Peak. The source for the revised estimate for 2023 and the estimate for 2024.
- Warren, R. (2025). The Undocumented Population in the United States Increased to 12.2 Million in 2023. Center for Migration Studies.
- Baker, B., and Warren, R. (2024). Estimates of the Unauthorized Immigrant Population Residing in the United States: January 2018 to January 2022. Department of Homeland Security, Office of Homeland Security Statistics.
- Biemer, P. P. (2010). Total survey error: Design, implementation, and evaluation. Public Opinion Quarterly, 74(5), 817 to 848.
2.11 Key Terms
- Adjustment error. Error that enters when weights are based on incorrect population totals.
- Bias. Error that pushes every result in the same direction.
- Coverage error. The difference between the target population and the sampling frame.
- Error. The difference between an estimate and the true value.
- Margin of error. A measure of sampling error. It does not cover the other six sources.
- Measurement error. The difference between the answer a respondent gives and the truth.
- Nonresponse error. Bias that arises when people who do not answer differ from those who do.
- Processing error. Error that enters when answers are coded, edited, or filled in.
- Residual method. An estimate made by subtracting one count from another.
- Sampling error. Variation in results that comes from measuring a sample and not the whole frame.
- Sampling frame. The list from which a sample is drawn.
- Target population. The group a survey aims to describe.
- Total survey error. A framework that lists every source of error in a survey estimate.
- Variable error. Error that differs from one run of a study to the next.
2.12 Exercises
Check Your Understanding
- Explain why a larger sample reduces variable error and does not reduce bias.
- A phone survey calls only landlines. Name the source of error and the group most likely to be left out.
- Which of the seven sources does a margin of error describe?
- Pew’s estimate for 2022 changed from 11.0 million to 11.8 million without new data. Which source of error does this illustrate?
Apply It
- Use the file
ch02-unauthorized-estimates.csv. Calculate the range of the estimates that refer to 2023. Express the range as a percent of the lowest estimate. - The foreign-born population is about 50 million. Suppose the legally present population is 36 million, and the survey misses 3 percent of all foreign-born people. Calculate the residual with and without a correction for the undercount. Show each step.
- A customer survey is emailed to everyone who bought a product in the past year. Twelve percent respond. List one possible problem under each of four sources of error.
Think Deeper
- A news report says two estimates “contradict” each other. One refers to January 2022 and the other to July 2023. Write two sentences that describe the relationship between them more accurately.
- All four groups count people with pending asylum claims as unauthorized. Give one argument for this choice and one against it. How should a report word the total so that readers do not misread it?
- Find a survey result in the news that reports a margin of error. Which of the other six sources is most likely to matter for that result, and why?