4 Measurement and Scales
Where this chapter fits. Step 4 of the research process is to design the method and the forms. This chapter covers the first half of that step, which is deciding how each concept will be measured.
4.1 Six Questions About Food
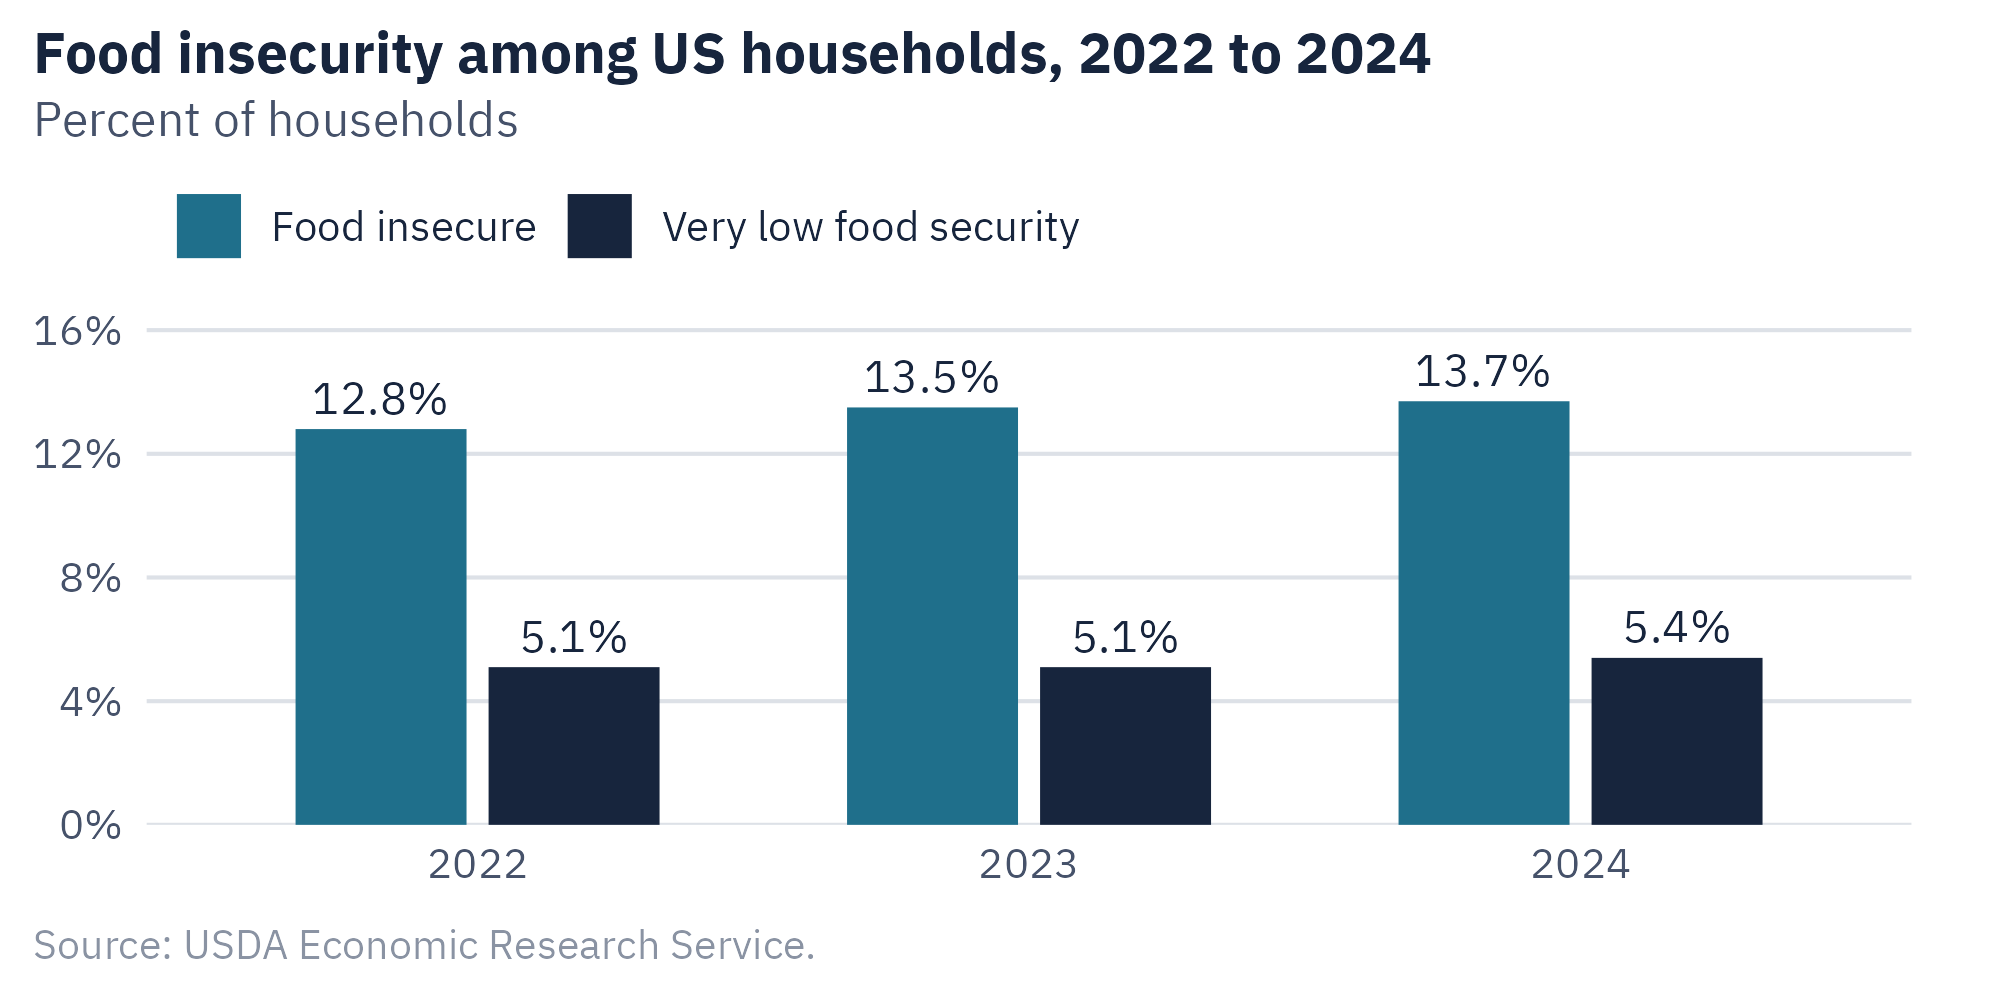
Each December, the Census Bureau adds a set of questions about food to its monthly survey of households. The US Department of Agriculture uses the answers to estimate how many households had trouble getting enough food during the year. In 2024, the estimate was 13.7 percent of households. The department calls these households food insecure.
No survey question asks, “Are you food insecure?” The term is a construct, and most respondents would not know what it means. The department builds the measure from a series of specific questions about what happened in the household. A short form of the measure uses six questions. Table 4.1 lists them.
| Question, about the last 12 months | Answer counted as a yes | |
|---|---|---|
| 1 | “The food that we bought just didn’t last, and we didn’t have money to get more.” | Often or sometimes true |
| 2 | “We couldn’t afford to eat balanced meals.” | Often or sometimes true |
| 3 | Did you or other adults in the household ever cut the size of meals or skip meals because there wasn’t enough money for food? | Yes |
| 4 | If yes to question 3, how often did this happen? | In three or more months |
| 5 | Did you ever eat less than you felt you should because there wasn’t enough money for food? | Yes |
| 6 | Were you ever hungry but didn’t eat because there wasn’t enough money for food? | Yes |
Each yes adds one point. A household with a score of 0 or 1 is classified as food secure. A score of 2 to 4 is low food security. A score of 5 or 6 is very low food security. Households in the last two groups are counted as food insecure.
The department has reported this measure every year since 1995. The report on 2024, released in December 2025, was the last in the series. The department has ended the annual report.
This chapter uses the six questions to explain how a measure is built from several items. It then covers the two tests that any measure has to pass.
4.2 Why Several Questions
A single question is often a weak measure of a construct. There are three reasons.
First, a construct usually has more than one part. Food insecurity includes worry about running out, lower quality of meals, and eating less. One question can cover only one of these.
Secondly, any single answer contains some random error. A respondent may misread a word or recall the wrong month. When several answers are added together, the random errors tend to cancel out.
Thirdly, a single yes-or-no question separates respondents into only two groups. Six questions give seven possible scores. The measure can then separate mild cases from severe ones.
A set of questions that are combined into one score is a scale. Each question is an item. The six food questions form a scale.
Many scales use Likert items. A Likert item presents a statement and asks how much the respondent agrees, usually with five ordered choices from “strongly disagree” to “strongly agree.” The choices are scored 1 to 5 and the item scores are added. Rensis Likert introduced the format in 1932, and it is now the most common format in survey research.
Some items in a scale may be worded in the opposite direction. On a job satisfaction scale, “I look forward to work” and “I often think about quitting” point in opposite directions. The second item has to be reverse scored before the items are added. On a five-point item, a 5 becomes a 1 and a 4 becomes a 2. A researcher who forgets this step will produce a score with little meaning.
4.3 How the Items Line Up
The six food questions were not chosen at random. They differ in how severe a situation they describe.
Many households with low incomes run out of food before the next paycheck. Far fewer go hungry for lack of money. A household that reports the severe experience has almost always had the milder ones as well.
Figure 4.2 shows this pattern in a simulated dataset. The file contains answers from 600 simulated households. It was mathematically modeled to reflect the ordering of the items that the department reports. It does not describe real households.
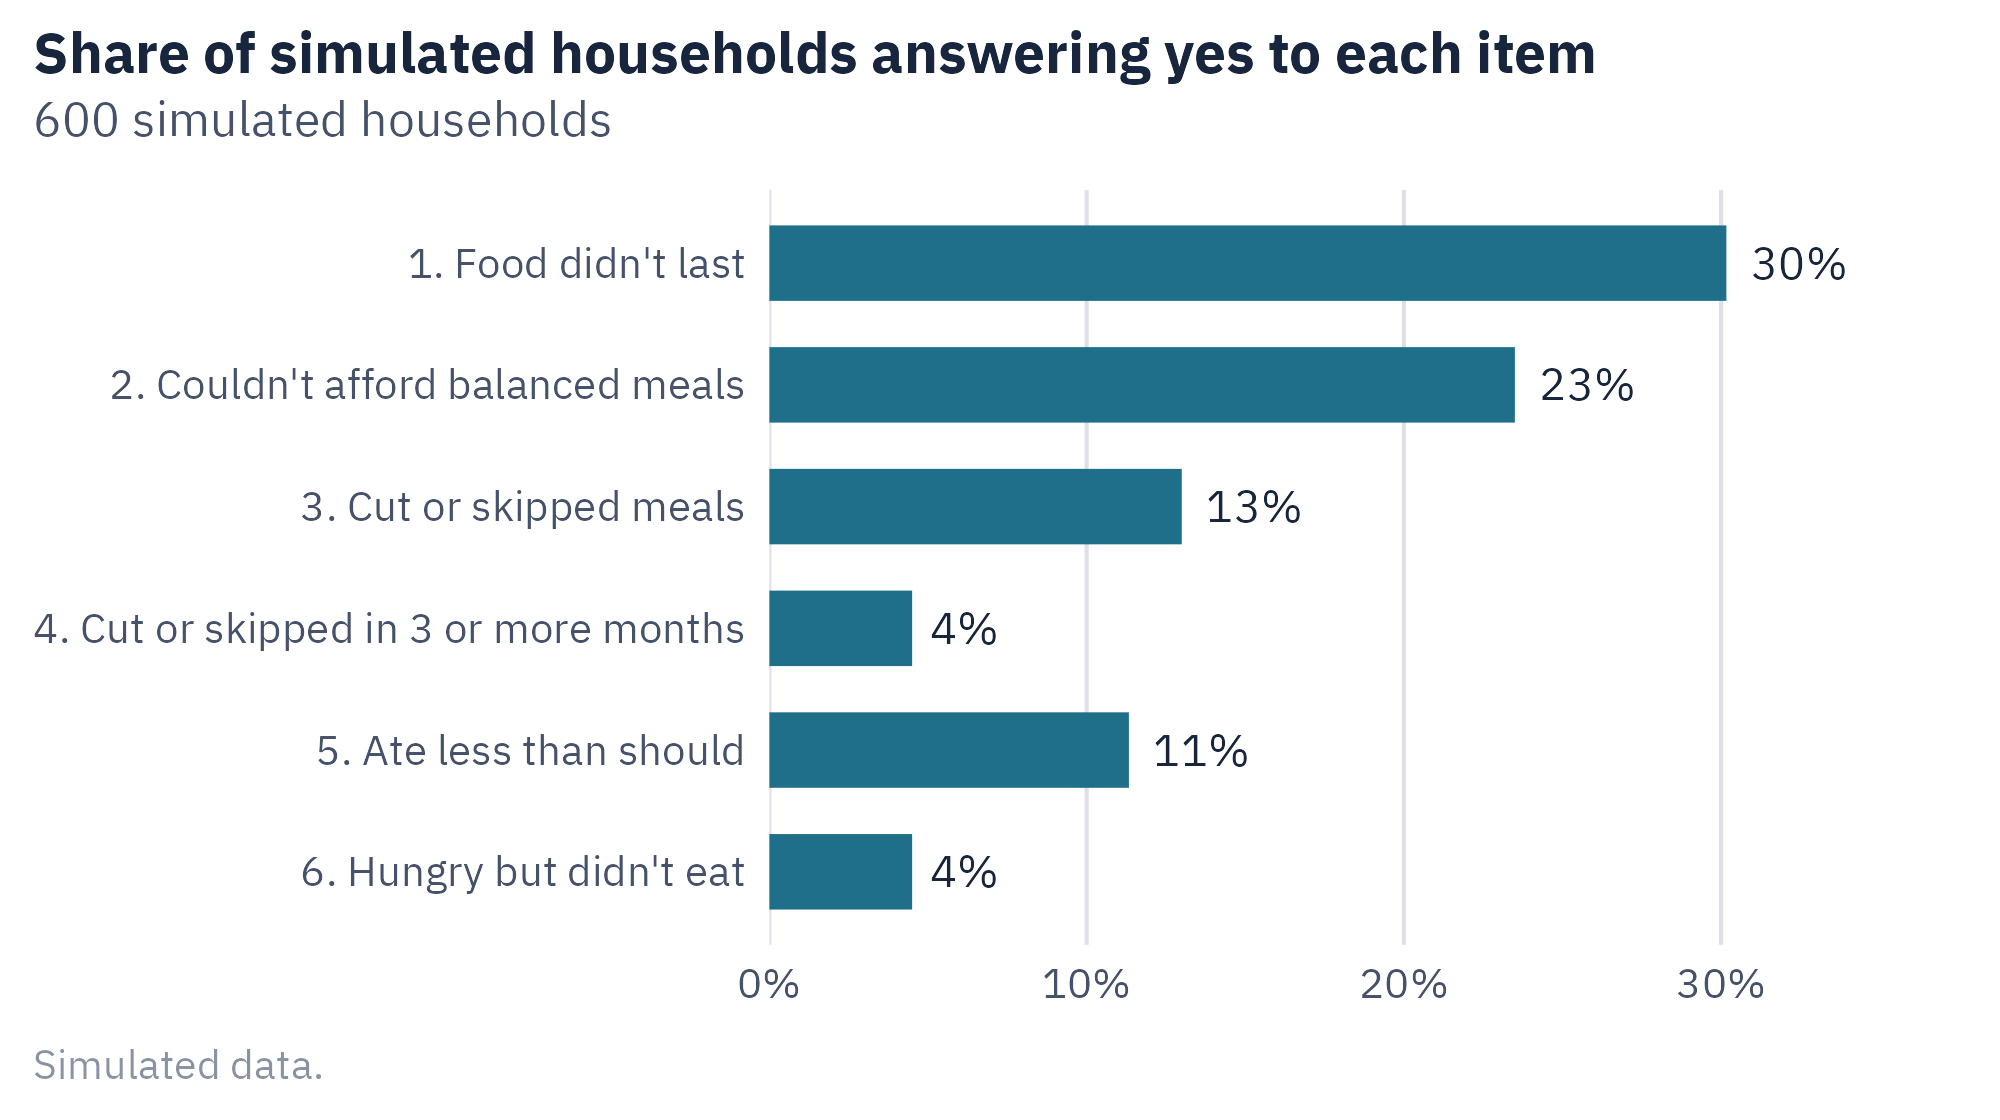
Because the items are ordered by severity, the total score has a clear meaning. A score of 1 usually means that food ran short at some point. A score of 6 means that an adult in the household went hungry. The cut points at 2 and 5 divide the range into three levels.
A cut point turns a score into a category. Cut points are useful for reporting, and they are also choices. Two households with scores of 1 and 2 may differ very little. The measure still places them in different groups. A report should state the cut points it used.
4.4 Reliability
A measure is reliable if it gives consistent results. A bathroom scale that shows a different weight each time you step on it is unreliable. Reliability is about consistency and not about accuracy. A scale that always reads five pounds too heavy is reliable.
Researchers check reliability in three main ways.
Test-retest reliability. The same people answer the same questions twice, a few weeks apart. If the construct has not changed, the two sets of scores should be highly correlated.
Inter-rater reliability. Two people score the same material independently. If the scoring rules are clear, the two sets of scores should agree. This check applies when a person has to make a judgment, such as rating the quality of an essay.
Internal consistency. The items in a scale are compared with one another. If they measure the same construct, respondents who say yes to one should tend to say yes to the others.
The usual statistic for internal consistency is Cronbach’s alpha. Its symbol is \(\alpha\). It compares the variance of the individual items with the variance of the total score.
\[\alpha = \frac{k}{k-1}\left(1 - \frac{\sum s_i^2}{s_T^2}\right)\]
In the formula, \(k\) is the number of items, \(s_i^2\) is the variance of item \(i\), and \(s_T^2\) is the variance of the total score. When the items rise and fall together, the total score varies more than the items do separately, and alpha is high.
Here is the calculation for the simulated file.
- Count the items. The scale has \(k = 6\) items.
- Calculate the variance of each item and add the six variances. The sum is 0.691.
- Calculate the total score for each household and find its variance. The variance is 1.986.
- Divide the first number by the second. The result is 0.348.
- Subtract from 1. The result is 0.652.
- Multiply by \(k/(k-1)\), which is \(6/5 = 1.2\). Alpha is 0.78.
Alpha ranges from 0 to 1 in most cases. By convention, a value of 0.70 or higher is treated as acceptable for research on groups. A value of 0.90 or higher is expected when a score will be used to decide something about one person. These are conventions and not strict limits.
4.5 Work With the Data: Scale Scorer
The steps above computed alpha by hand for the six food items. The tool does the same work in two parts. Part 1 scores one household. Part 2 computes alpha for the simulated file of 600 households.
Open Scale Scorer in its own window
- In Part 1, answer yes to one item at a time. Note the score at which the category changes to low food security, and then to very low food security.
- In Part 2, read alpha for all six items. It matches the value computed above.
- Remove one item and record alpha. Put the item back and remove a different one. Note which item changes alpha the most.
- Remove items one at a time until two remain. Record alpha at each step.
Alpha usually falls as a scale gets shorter, even when the remaining items are no worse than before. The note that follows explains why this limits what alpha can show.
The simulated answers are in the file ch04-simulated-items.csv at quant.marginoferrormedia.com/data.
What Alpha Does Not Show
Alpha rises when items are added, even weak ones. A scale with 30 items can reach a high alpha with items that are only loosely related. Alpha also does not show that the items measure one construct. Two groups of items that measure two different things can produce a high alpha together. Report alpha, and also examine how each item relates to the others.
4.6 Validity
A measure is valid if it measures the construct it is meant to measure. Reliability is necessary for validity, and it is not enough. The bathroom scale that reads five pounds too heavy is reliable and not valid.
Validity cannot be shown with one number. Researchers build a case for it from several kinds of evidence.
Content validity. The items should cover all parts of the construct and nothing outside it. Experts in the field review the items to check this. The food security items cover worry, quality of meals, and quantity of food. They do not cover the nutritional value of what was eaten, and the department states that the measure does not assess nutrition.
Criterion validity. Scores should relate to an outside standard that is already accepted. Households classified as food insecure should, on average, spend less on food. The department reports this check each year. In 2024, the typical food-secure household spent about 11 percent more on food than the typical food-insecure household of the same size and makeup.
Construct validity. Scores should relate to other measures in the ways that theory predicts. Two kinds of evidence support it. Convergent validity means that the measure correlates with measures of related constructs, such as income. Discriminant validity means that the measure does not correlate strongly with measures of unrelated constructs.
Table 4.2 shows how reliability and validity combine.
| Valid | Not valid | |
|---|---|---|
| Reliable | The measure is consistent and measures the right construct. This is the goal. | The measure is consistent and measures the wrong thing. This case is hard to detect, because the results look stable. |
| Not reliable | Not possible. An inconsistent measure cannot be valid. | The measure is inconsistent and its results cannot be interpreted. |
4.7 A Name Is Part of the Measure
Until 2006, the department’s most severe category was labeled “food insecurity with hunger.” A panel of the National Academies reviewed the measure and reported its findings that year. The panel concluded that the questions measure a household’s access to food. Hunger is a physical condition of a person, and the panel found that the questions do not measure it directly. The department changed the label to “very low food security.”
The questions did not change. The scores did not change. The label changed because it claimed more than the items could support. This is a validity question about the name of a measure. A reader of any report should check whether the label on a number matches the questions behind it.
4.8 Borrow Before You Build
A new scale takes months to develop and test. For most constructs, a tested scale already exists. A researcher who uses an existing scale gains two things. The scale has known reliability and validity. The results can also be compared with those of other studies that used the same scale.
If you use an existing scale, use it as written. Changing the wording, the order, or the answer choices can change how it performs, and the published evidence no longer applies. If you have to change it, report the change and check reliability again with your own data.
Ethics Moment: Asking About Hardship
The food questions ask people to report that they could not feed their household. For some respondents, that is a painful thing to say. A researcher has three duties here. Ask only what the study needs. Tell respondents that they may skip any question. Protect the answers so that no one can be identified. Short, tested scales help with the first duty, because they collect the needed information with fewer questions. Chapter 5 covers how the wording and the order of questions affect a respondent’s comfort.
AI Reality Check: A Scale That Reads Well Is Not a Tested Scale
A language model can write ten Likert items on any topic in seconds. The items will be grammatical and will look like a scale. They have not been tested. No one knows their reliability, and no one has checked that they measure the construct. A model may also reproduce the items of a published scale with small changes in wording. The published evidence then no longer applies, and the copy may breach a copyright. Use a model to find candidate scales and to draft items for testing. Then test them with real respondents before you rely on the scores.
4.9 Putting It All Together
A scale combines several items into one score. Several items cover more of a construct than one item can, and their random errors tend to cancel out. The six-item food security scale orders its items by severity, so that a higher score means a more severe situation. Cut points turn the score into categories.
A measure has to be reliable and valid. Reliability is consistency, and Cronbach’s alpha is the usual statistic for the internal consistency of a scale. Validity is whether the measure captures the intended construct. The case for validity rests on content, criterion, and construct evidence.
The label on a measure is part of the measure. The department removed the word “hunger” from its categories because the questions did not measure hunger directly.
4.10 Looking Ahead
This chapter treated the wording of the six questions as given. Each word in them was tested before the questions were used. Chapter 5 covers how questions are written and how small changes in wording can change the answers. It also covers how to test a questionnaire before it is used.
4.11 Further Reading and References
- Rabbitt, M. P., Reed-Jones, M., Hales, L. J., Suttles, S., and Burke, M. P. (2025). Household Food Security in the United States in 2024 (ERR-358). US Department of Agriculture, Economic Research Service. The source for the 2022 to 2024 figures.
- Bickel, G., Nord, M., Price, C., Hamilton, W., and Cook, J. (2000). Guide to Measuring Household Food Security. US Department of Agriculture, Food and Nutrition Service. The guide describes the items and the scoring.
- National Research Council (2006). Food Insecurity and Hunger in the United States: An Assessment of the Measure. National Academies Press. The panel report that led to the change in labels.
- Cronbach, L. J. (1951). Coefficient alpha and the internal structure of tests. Psychometrika, 16(3), 297 to 334.
- DeVellis, R. F., and Thorpe, C. T. (2021). Scale Development: Theory and Applications (5th ed.). Sage. A practical guide to building and testing a scale.
- Likert, R. (1932). A technique for the measurement of attitudes. Archives of Psychology, 22(140), 1 to 55.
4.12 Key Terms
- Construct validity. Evidence that scores relate to other measures in the ways theory predicts.
- Content validity. Evidence that the items cover all parts of the construct.
- Convergent validity. Evidence that a measure correlates with measures of related constructs.
- Criterion validity. Evidence that scores relate to an accepted outside standard.
- Cronbach’s alpha. A statistic for the internal consistency of a scale.
- Cut point. A score that divides respondents into categories.
- Discriminant validity. Evidence that a measure does not correlate strongly with unrelated constructs.
- Internal consistency. The degree to which the items in a scale go together.
- Inter-rater reliability. Agreement between two people who score the same material.
- Item. One question in a scale.
- Likert item. A statement with ordered choices from strong disagreement to strong agreement.
- Reliability. The consistency of a measure.
- Reverse scoring. Flipping the scores of an item worded in the opposite direction.
- Scale. A set of items combined into one score.
- Test-retest reliability. Agreement between scores from the same people at two times.
- Validity. Whether a measure captures the construct it is meant to measure.
4.13 Exercises
Check Your Understanding
- Give two reasons a scale of several items is usually better than a single question.
- A measure gives the same wrong answer every time. Is it reliable? Is it valid?
- Match each check to a kind of validity. (a) Experts review the items for coverage. (b) Scores are compared with household food spending. (c) Scores are compared with a measure of income.
- Why did the department remove the word “hunger” from its category labels in 2006?
Apply It
- A household answers yes to items 1, 2, and 5 and no to the rest. Calculate the score and name the category.
- A four-item scale has item variances of 0.9, 1.1, 1.0, and 1.2. The variance of the total score is 9.8. Calculate Cronbach’s alpha. Show each step.
- Use the file
ch04-simulated-items.csv. Calculate the total score for each household. What share of the simulated households falls in each of the three categories?
Think Deeper
- A household with a score of 1 is “food secure,” and a household with a score of 2 is “food insecure.” What is gained and what is lost by reporting categories in place of scores?
- The department has ended its annual report. What would a researcher lose if the same six questions were no longer asked each year? What could replace them, and with what loss in comparability?
- Choose a construct that interests you, such as loneliness or financial stress. Find a published scale that measures it. Report the number of items, a sample item, and the reliability the authors report.