7 Collecting and Cleaning Data
Where this chapter fits. Step 6 of the research process is to collect the data, and step 7 begins with preparing the file. This chapter covers both.
7.1 A Thousand Completed Surveys
A housing nonprofit wants to know how many renters in its region spend more than they can afford on rent. It buys 1,000 completed surveys from an online panel company. The survey takes about seven minutes. Within two days, the file arrives with 1,000 rows.
The first tabulation shows that 38.9 percent of respondents report a rent burden. Before the staff reports that figure, an analyst looks at the file more closely. Some respondents finished in under a minute. Some gave the same answer to every item in a six-item grid, including an item that was worded in reverse. Several typed the same sentence into the open-ended box, and one of those sentences begins “As an AI language model.”
The panel in this chapter is simulated. It contains 880 attentive respondents and 120 planted cases. Seventy of the planted cases are careless people who rushed through. Fifty are automated programs, or bots. The file was mathematically modeled to reflect patterns that researchers have reported in real opt-in panels. Because the planted cases are known, a reader can test each screening rule and see what it catches and what it misses.
The problem is real. The Pew Research Center tested several opt-in panels in 2019. It estimated that 4 to 7 percent of respondents gave bogus answers (Kennedy et al., 2020). A later Pew study asked opt-in respondents whether they were licensed to operate a nuclear submarine. Among those under age 30, 12 percent said yes (Mercer, Kennedy, and Keeter, 2024). The true share of adults with that license is close to zero.
This chapter covers the step between a questionnaire and a dataset. It begins with how data are collected and ends with a clean, documented file.
7.2 Modes of Collection
The way a survey reaches people is its mode. Table 7.1 compares the four main modes.
| Mode | Strengths | Limits |
|---|---|---|
| In person | Highest response rates. An interviewer can explain questions and show materials. | Highest cost. Respondents may shade answers on sensitive topics. |
| Telephone | An interviewer can clarify questions. Faster than in person. | Response rates have fallen sharply. Long lists of choices are hard to follow by ear. |
| Reaches almost every household through address lists. Private for sensitive questions. | Slow. No one can clarify a question. Routing has to be simple. | |
| Web | Lowest cost and fastest. Routing is automatic. Private. | Leaves out people without internet access. Opt-in panels are not probability samples. |
Many surveys now combine modes. A common design mails an invitation to a random sample of addresses and asks people to respond online. Those who do not respond receive a paper form. This design uses a probability sample and still collects most responses at web cost.
Mode affects answers as well as cost. Respondents report more sensitive behavior on a self-completed form than to an interviewer. A researcher who changes mode between two years of a survey should expect some of the change in results to come from the mode.
7.3 Consent and Confidentiality
Before a respondent answers, the researcher has to obtain informed consent. The respondent is told the purpose of the study, how long it will take, any risks, and that taking part is voluntary. The respondent may skip any question and may stop at any time.
Two terms describe how answers are protected, and they are often confused.
A survey is anonymous if no one, including the researcher, can link answers to a person. A survey is confidential if the researcher can make the link and promises not to reveal it. A panel survey that pays respondents is confidential and not anonymous, because the panel company knows who answered. A researcher should state which protection applies and should not promise anonymity that the design cannot deliver.
Most universities and many agencies require that a review board approve a study with human participants before data collection begins. The board checks that risks are small, that consent is informed, and that the data will be protected.
7.4 Monitoring the Field
Data collection needs attention while it is under way. Three numbers are worth checking daily.
The response rate is the share of sampled units that complete the survey. It applies to probability samples. For an opt-in panel, no response rate can be calculated, because no defined sample was invited. The break-off rate is the share of respondents who start and do not finish. A high break-off rate at one question often means that the question is confusing or intrusive. The completion time shows whether the survey is as long as planned and whether some respondents are moving too fast to have read it.
Incentives raise response. A small payment sent in advance, with no condition attached, generally raises response more than a larger payment promised for completion. In opt-in panels, payment is the reason people take part. It is also the reason that some people and some programs complete surveys as fast as possible.
7.5 Four Signs of a Low-Quality Response
Researchers use several checks to find responses that should not be trusted. Each one is a rule applied to the data.
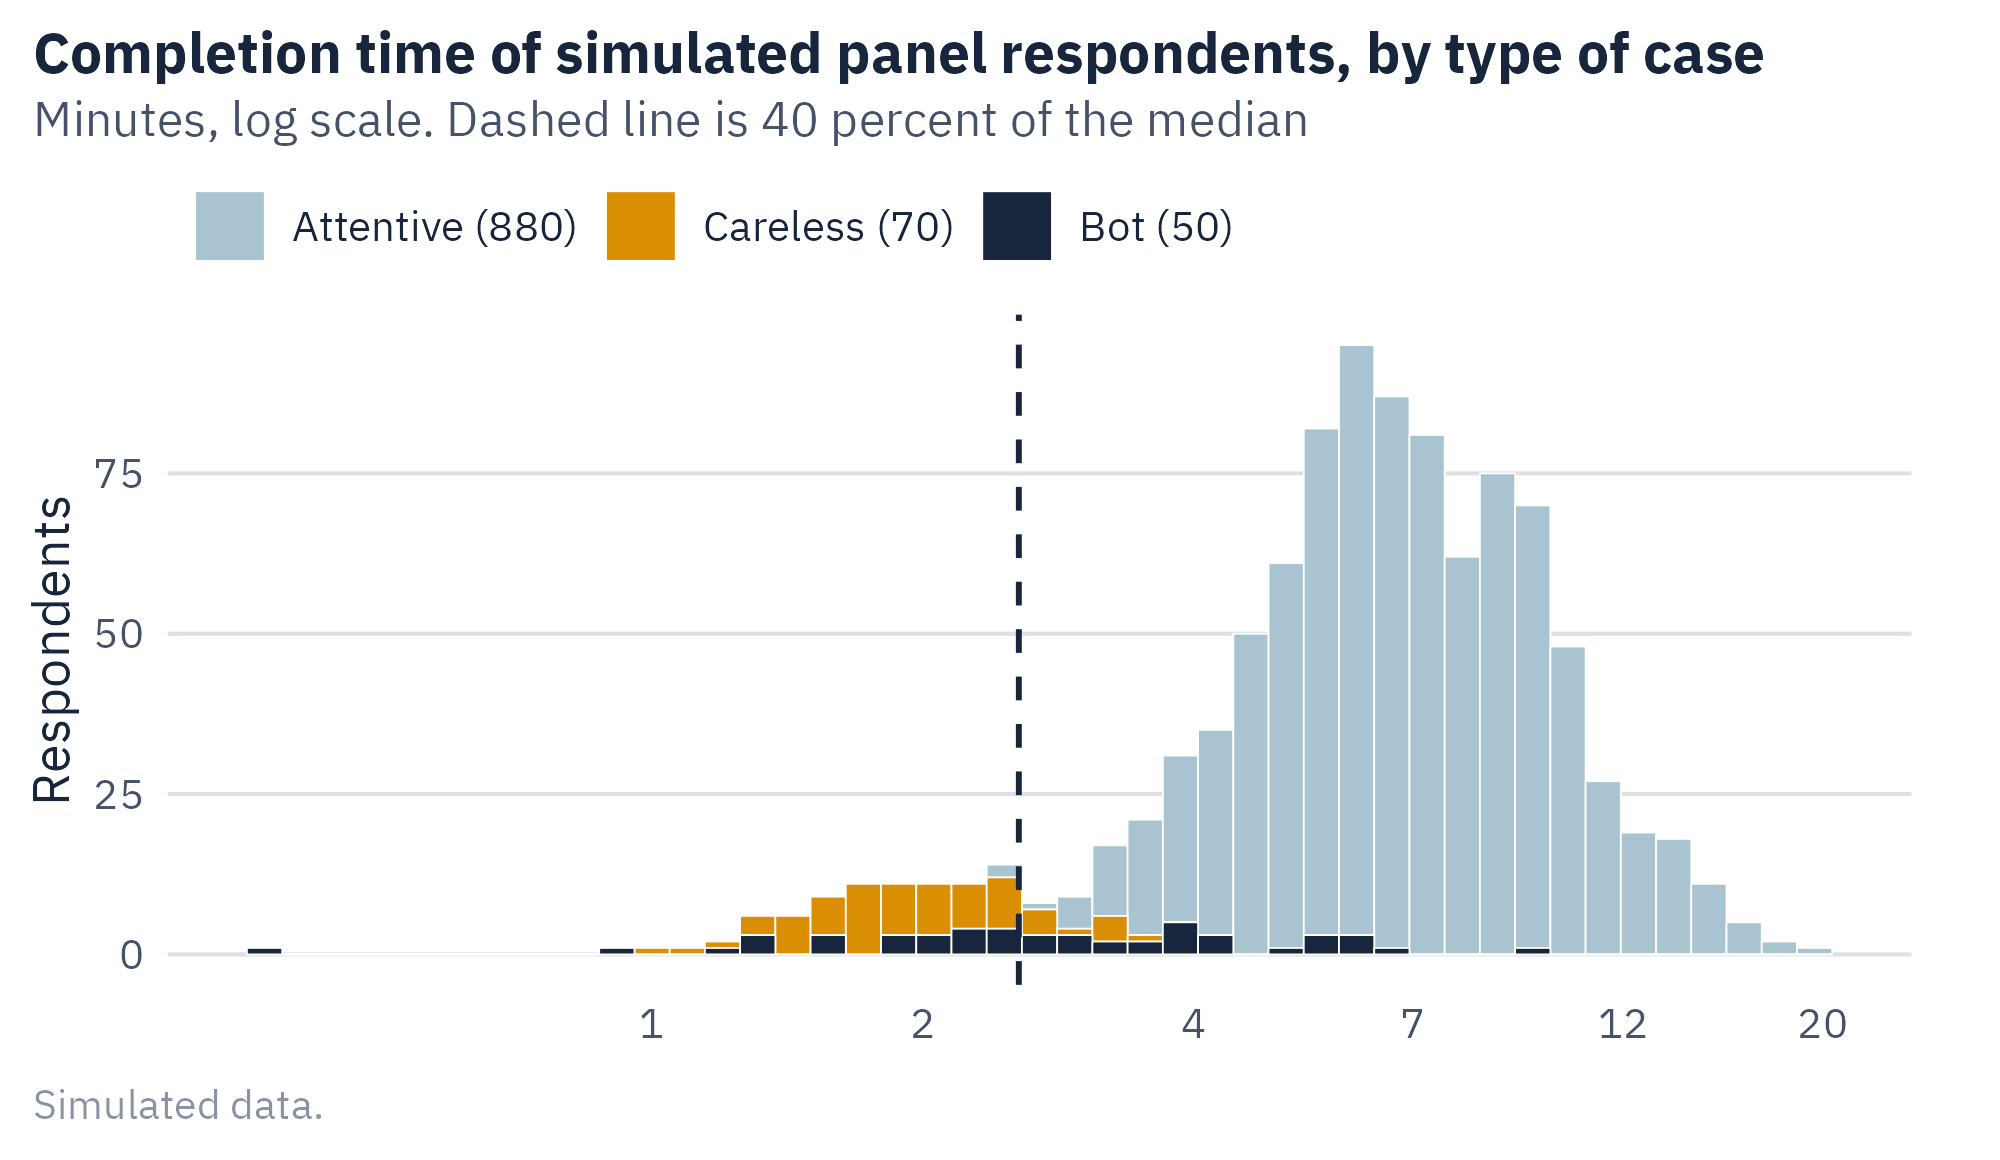
Speeding. A respondent who finishes far faster than the typical respondent has probably not read the questions. A common rule flags anyone who finishes in less than 40 percent of the median time.
Straightlining. A respondent gives the same answer to every item in a grid. When the grid includes an item worded in reverse, identical answers contradict each other.
Attention checks. The survey includes a question with one correct answer, such as “Select ‘somewhat disagree’ for this item.” A respondent who fails it was not reading.
Open-ended answers. A text box collects an answer in the respondent’s own words. Empty answers, one-word answers, off-topic sentences, and identical sentences across respondents are all signs of a problem.
Figure 7.1 shows the completion times in the simulated file.
No single check finds every bad case. Table 7.2 shows what each rule catches in the simulated file.
| Rule | Careless caught (of 70) | Bots caught (of 50) | Attentive flagged (of 880) |
|---|---|---|---|
| Speeding | 59 | 23 | 2 |
| Straightlining | 45 | 0 | 3 |
| Failed attention check | 40 | 21 | 25 |
| Open-ended answer | 44 | 30 | 0 |
| Any one flag | 68 | 44 | 30 |
| Two or more flags | 62 | 23 | 0 |
The table shows a trade-off. A rule that removes anyone with a single flag catches most of the planted cases. It also removes some attentive respondents, such as a fast reader or someone who misread the attention check. A rule that requires two flags removes fewer attentive respondents and lets more bad cases through.
A rule that removes attentive respondents has a cost. If fast readers are younger, a strict speed rule removes younger people at a higher rate, and the sample changes. Many researchers therefore require at least two flags before removing a case. They report how many cases each rule removed.
7.6 What Screening Does to the Result
The planted cases did not answer the rent question the way attentive respondents did. Bots that answer at random choose “yes” about half the time, and in this file they were set to say yes more often. Careless respondents are close to half and half.
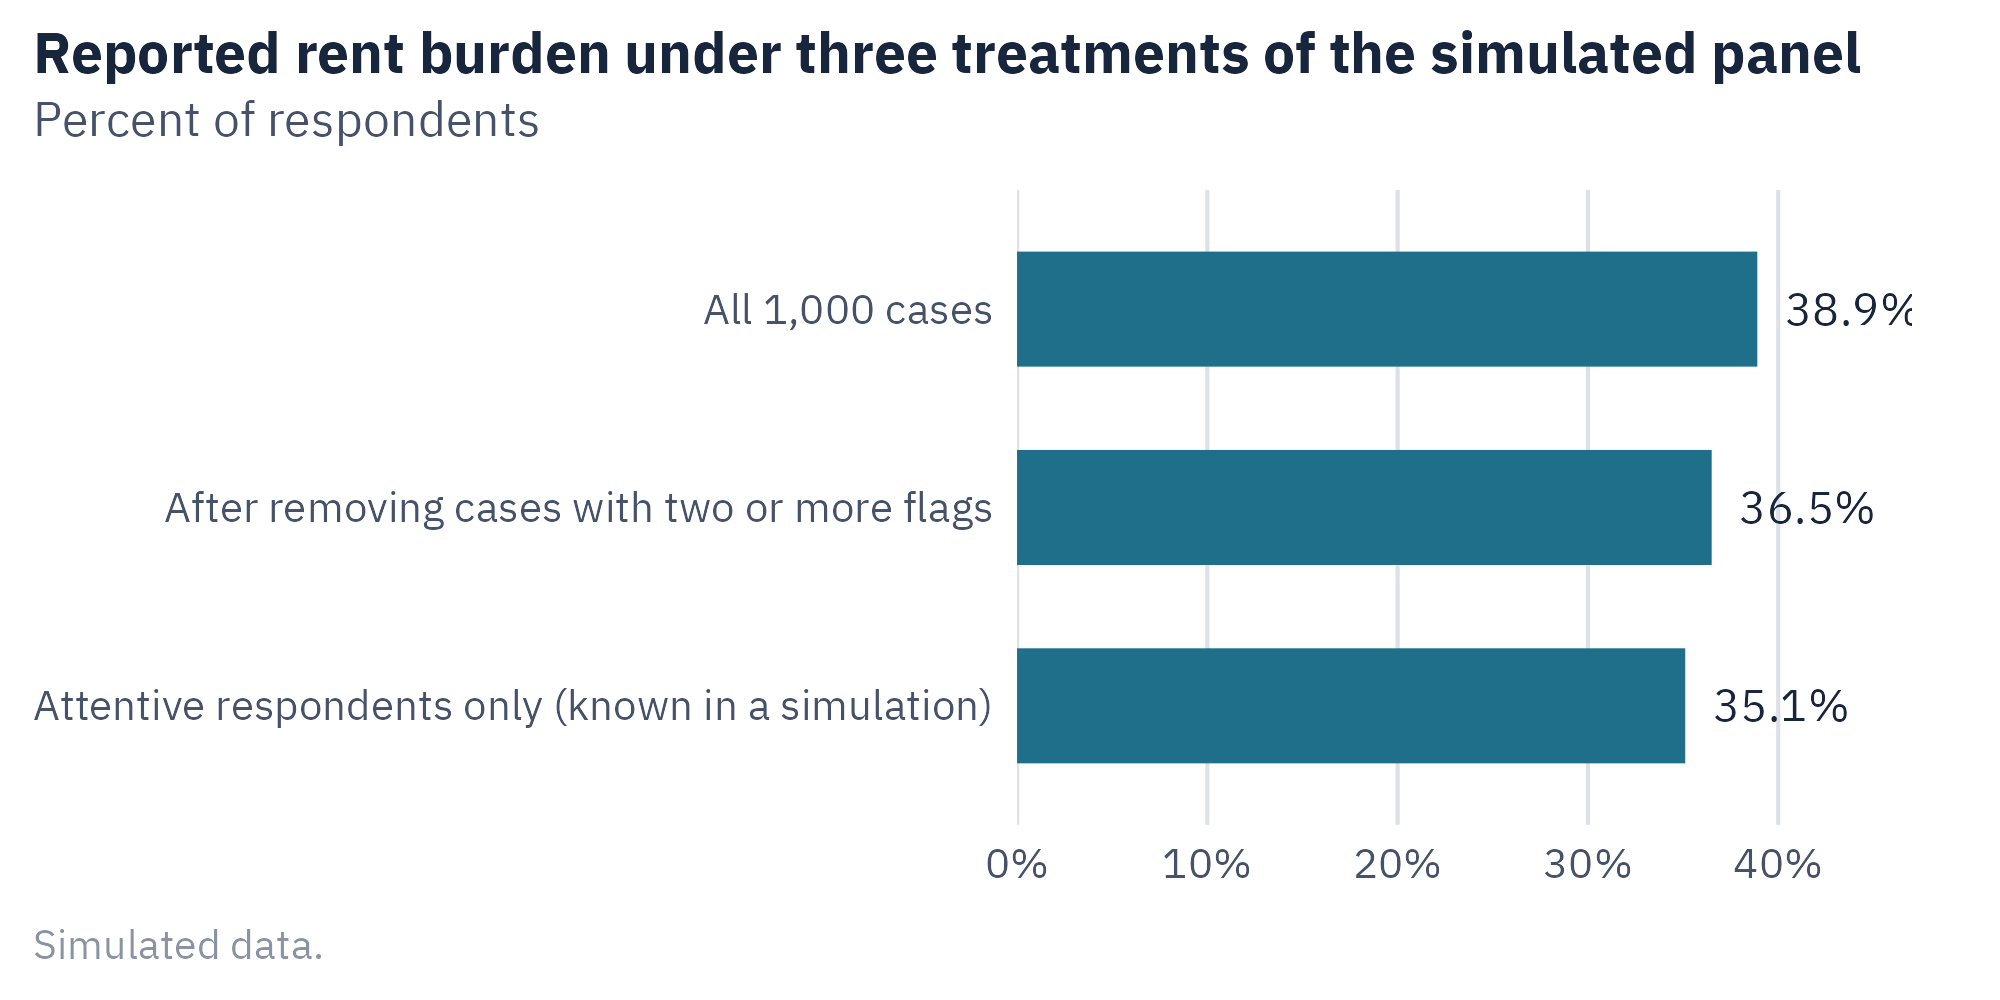
Figure 7.2 shows the effect. With all 1,000 cases, the estimate is 38.9 percent. Among the 880 attentive respondents, it is 35.1 percent. After the two-flag rule, the estimate is 36.5 percent. That is closer to the attentive figure and still above it, because some planted cases passed the rule.
Twelve percent of the file was bad, and the estimate moved by about 4 points. Bad cases do the most damage when the true share is far from 50 percent. Random answers pull every estimate toward the middle. A rare condition will appear more common than it is, which is the pattern in the Pew submarine result.
7.7 Work With the Data: Response Quality Screener
The section above applied one screening rule to the simulated panel. The tool lets you try other rules on the same 1,000 cases. Because the file is simulated, the tool can show which cases each rule removed.
Open Response Quality Screener in its own window
- Start with all four flags selected and a threshold of two flags. The tool removes 85 cases. Read the table to see how many were attentive, careless, or bots.
- Change the threshold to one flag. The tool now removes 142 cases, and 30 of them are attentive respondents.
- Change the threshold to three flags. Fewer attentive respondents are removed, and more planted cases stay in the file.
- Return to two flags. Turn off one flag at a time and note which planted cases each flag was catching.
Each rule is a trade. A strict rule removes more bad cases and more good ones. A lenient rule keeps the good cases and leaves bad ones in. Compare the rent estimate after screening with the estimate for attentive respondents only. No rule in the tool closes the gap completely.
The file is ch07-simulated-panel.csv at quant.marginoferrormedia.com/data.
7.8 Cleaning the File
The screen for low-quality responses is one part of data cleaning. The full process has several steps, and the order matters.
- Keep the raw file. Save the file exactly as it arrived and never edit it. All cleaning is done on a copy, with a script or a written log.
- Write a codebook. A codebook lists every variable, its question wording, its allowed values, and the codes for missing data.
- Check ranges. Each variable should contain only allowed values. An age of 212 or a rating of 7 on a five-point scale is an entry error.
- Check consistency. Answers should agree with one another. A respondent who reports no children should not report a child’s age.
- Find duplicates. The same person may appear twice. Check respondent identifiers and, in web surveys, repeated device or network addresses.
- Apply the screening rules. Use the rules for speeding, straightlining, attention, and open-ended answers.
- Examine missing data. Count the missing values for each variable and check whether they are concentrated in one group.
- Record every decision. A cleaning log states each rule, the number of cases it affected, and the reason for it.
Missing data needs care. When a respondent skips a question, the simplest approach is to leave that respondent out of any analysis that uses the question. This is acceptable when few values are missing and they are not concentrated in one group. If one in four respondents skipped the income question, the people who answered it may not represent the rest. A researcher should report the share missing for every key variable.
An outlier is a value far from the others. An outlier can be an error, such as a rent of $85,000 a month that was meant to be $850. It can also be a real and unusual case. Check outliers against other answers before changing them. Do not remove a value only because it is unusual.
Decide the Rules Before You See the Results
Set the screening rules before you look at the main results. A researcher who tries several rules and keeps the one that gives the preferred answer has chosen the result. Write the rules down in advance, apply them once, and report them.
Ethics Moment: Removing People From the Data
Every screening rule removes some real people who answered in good faith. Speed rules remove fast readers. Attention checks are failed more often by people reading in a second language. Rules about open-ended answers penalize people who write little. A researcher has a duty to check who is being removed. Compare the removed cases with the kept cases on age, education, and language. If one group is removed at a much higher rate, the rule is changing the sample, and the report should say so.
AI Reality Check: Bots That Pass the Checks
The checks in this chapter were designed for careless people and simple bots. Programs built on language models are harder to detect. They can read a question, give consistent answers, pass an attention check, and write a plausible open-ended answer. Westwood (2025) built such a program and reported that it passed nearly all of the standard checks. No screening rule is a full defense. The stronger protection is in the sample. A panel recruited from a random sample of addresses gives a fraudulent respondent no easy way to join. When a study has to use an opt-in panel, use several checks, expect some bad cases to remain, and report the limits.
7.9 Putting It All Together
Mode affects cost, coverage, and the answers themselves. Before collecting data, a researcher obtains informed consent and states whether answers are anonymous or confidential.
Online opt-in panels contain some responses from careless people and automated programs. Four checks help find them. They are speeding, straightlining, attention checks, and a review of open-ended answers. No single check is enough, and every check removes some attentive respondents. In the simulated file, 12 percent of the cases were planted, and they moved the main estimate by about 4 percentage points.
Data cleaning starts with an untouched raw file and ends with a codebook and a log of every decision. Screening rules should be set before the results are known.
7.10 Looking Ahead
The file is now clean. Chapter 8 covers the last two steps, which are the analysis plan and the report. The case is a file of 534 workers. It supports several different estimates of the pay gap between women and men, depending on choices the analyst makes.
7.11 Further Reading and References
- Kennedy, C., Hatley, N., Lau, A., Mercer, A., Keeter, S., Ferno, J., and Asare-Marfo, D. (2020). Assessing the Risks to Online Polls From Bogus Respondents. Pew Research Center.
- Mercer, A., Kennedy, C., and Keeter, S. (2024). Online Opt-In Polls Can Produce Misleading Results, Especially for Young Adults and Hispanic Adults. Pew Research Center. The source of the submarine result.
- Westwood, S. J. (2025). The potential existential threat of large language models to online survey research. Proceedings of the National Academy of Sciences, 122.
- Meade, A. W., and Craig, S. B. (2012). Identifying careless responses in survey data. Psychological Methods, 17(3), 437 to 455. A comparison of methods for finding careless respondents.
- Krosnick, J. A. (1991). Response strategies for coping with the cognitive demands of attitude measures in surveys. Applied Cognitive Psychology, 5(3), 213 to 236. The source of the term satisficing.
- Dillman, D. A., Smyth, J. D., and Christian, L. M. (2014). Internet, Phone, Mail, and Mixed-Mode Surveys (4th ed.). Wiley.
7.12 Key Terms
- Anonymous. No one, including the researcher, can link answers to a person.
- Attention check. A question with one correct answer, used to test whether a respondent is reading.
- Break-off rate. The share of respondents who start a survey and do not finish.
- Cleaning log. A record of each cleaning rule, the cases it affected, and the reason for it.
- Codebook. A list of every variable with its wording, allowed values, and missing-data codes.
- Confidential. The researcher can link answers to a person and promises not to reveal the link.
- Data cleaning. The process of checking and correcting a data file before analysis.
- Informed consent. Agreement to take part after being told the purpose, risks, and voluntary nature of a study.
- Missing data. Values that are absent because a respondent skipped a question or broke off.
- Mode. The way a survey reaches respondents, such as mail, telephone, or web.
- Outlier. A value far from the other values of a variable.
- Speeding. Completing a survey far faster than the typical respondent.
- Straightlining. Giving the same answer to every item in a grid.
7.13 Exercises
Check Your Understanding
- Explain the difference between an anonymous survey and a confidential one. Which applies to a paid online panel?
- Why is a straightlined grid more informative when one item is worded in reverse?
- Random answers pull an estimate toward 50 percent. Explain why this makes a rare condition look more common.
- Why should the raw data file never be edited?
Apply It
- A survey has a median completion time of 9 minutes. At what time would the 40 percent rule flag a respondent for speeding? Show the calculation.
- Use the file
ch07-simulated-panel.csv. Apply the speeding rule and the attention check. How many cases does each one flag, and how many are flagged by both? - A file has 1,200 cases. A screening rule removes 96 of them. The estimate of interest is 22 percent before the rule and 19 percent after. Write two sentences for the methods section of a report that state what was done.
Think Deeper
- A screening rule removes 6 percent of respondents with a college degree and 15 percent of respondents without one. What would you check next, and what would you report?
- A colleague proposes trying five screening rules and keeping the one that gives the cleanest result. Explain the problem with this plan and propose an alternative.
- Programs built on language models can now pass most attention checks. Describe two changes to the design of a study that would reduce the risk without relying on a screening rule.